Environmental Impact
Report
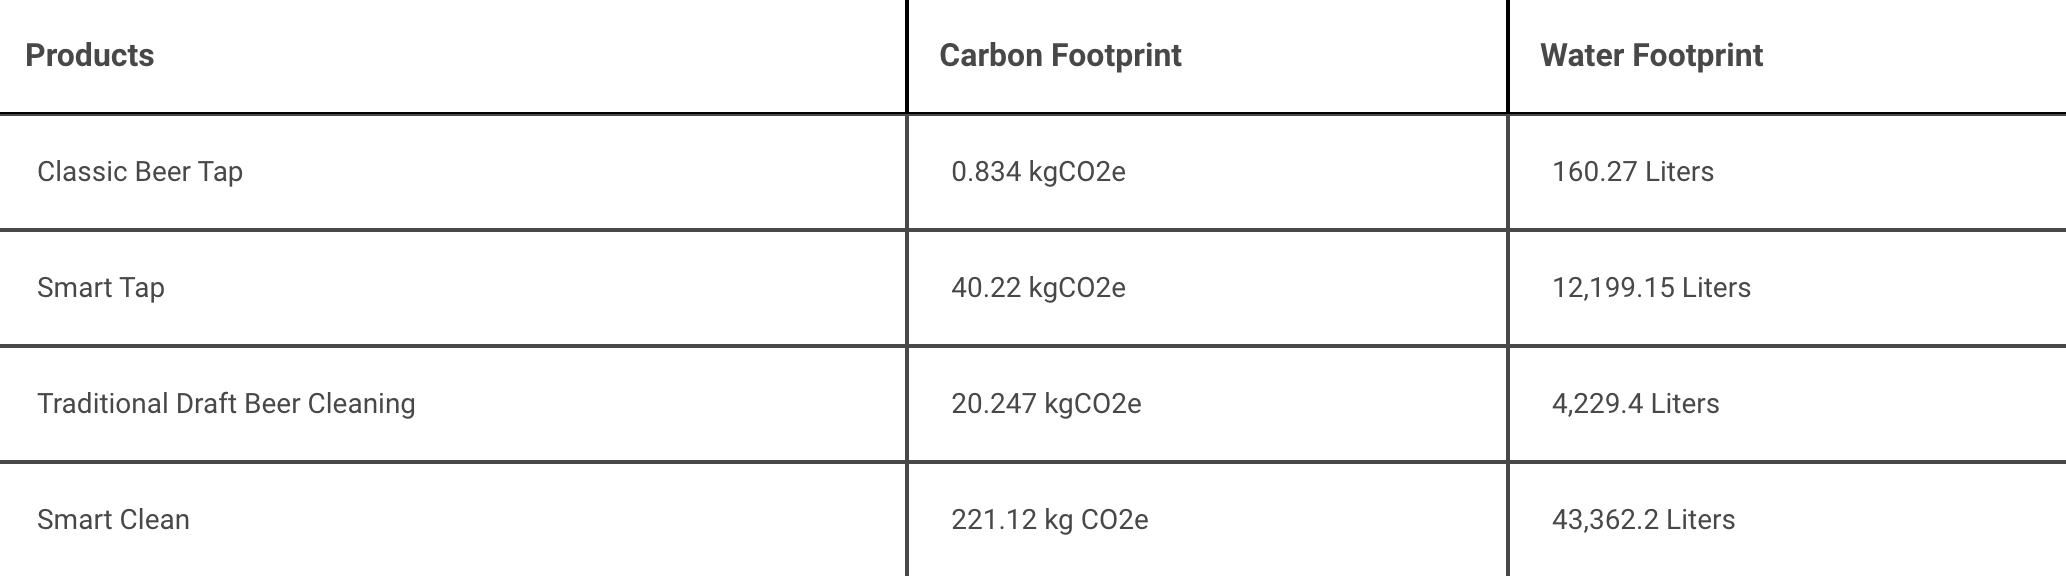
This report provides a comprehensive overview of Pubinno’s sustainability initiatives, with a focus on the carbon and water footprints of its Smart Clean and Smart Tap products. This analysis has been conducted to assess the sustainability performance of Smart Tap and Smart Clean.
This analysis has been conducted to assess the sustainability performance of Smart Tap and Smart Clean. The calculations in the report are based on ISO 14064 and ISO 14046 standards. The analysis takes into account the materials used, logistics in the production process, and electricity consumption during product use. It is assumed that the classical cleaning method and the materials used for the tap are entirely made of stainless steel. The logistics aspect is considered the same for both the classical cleaning method and Smart Tap. The emission factors are determined based on data obtained from credible sources.
512%
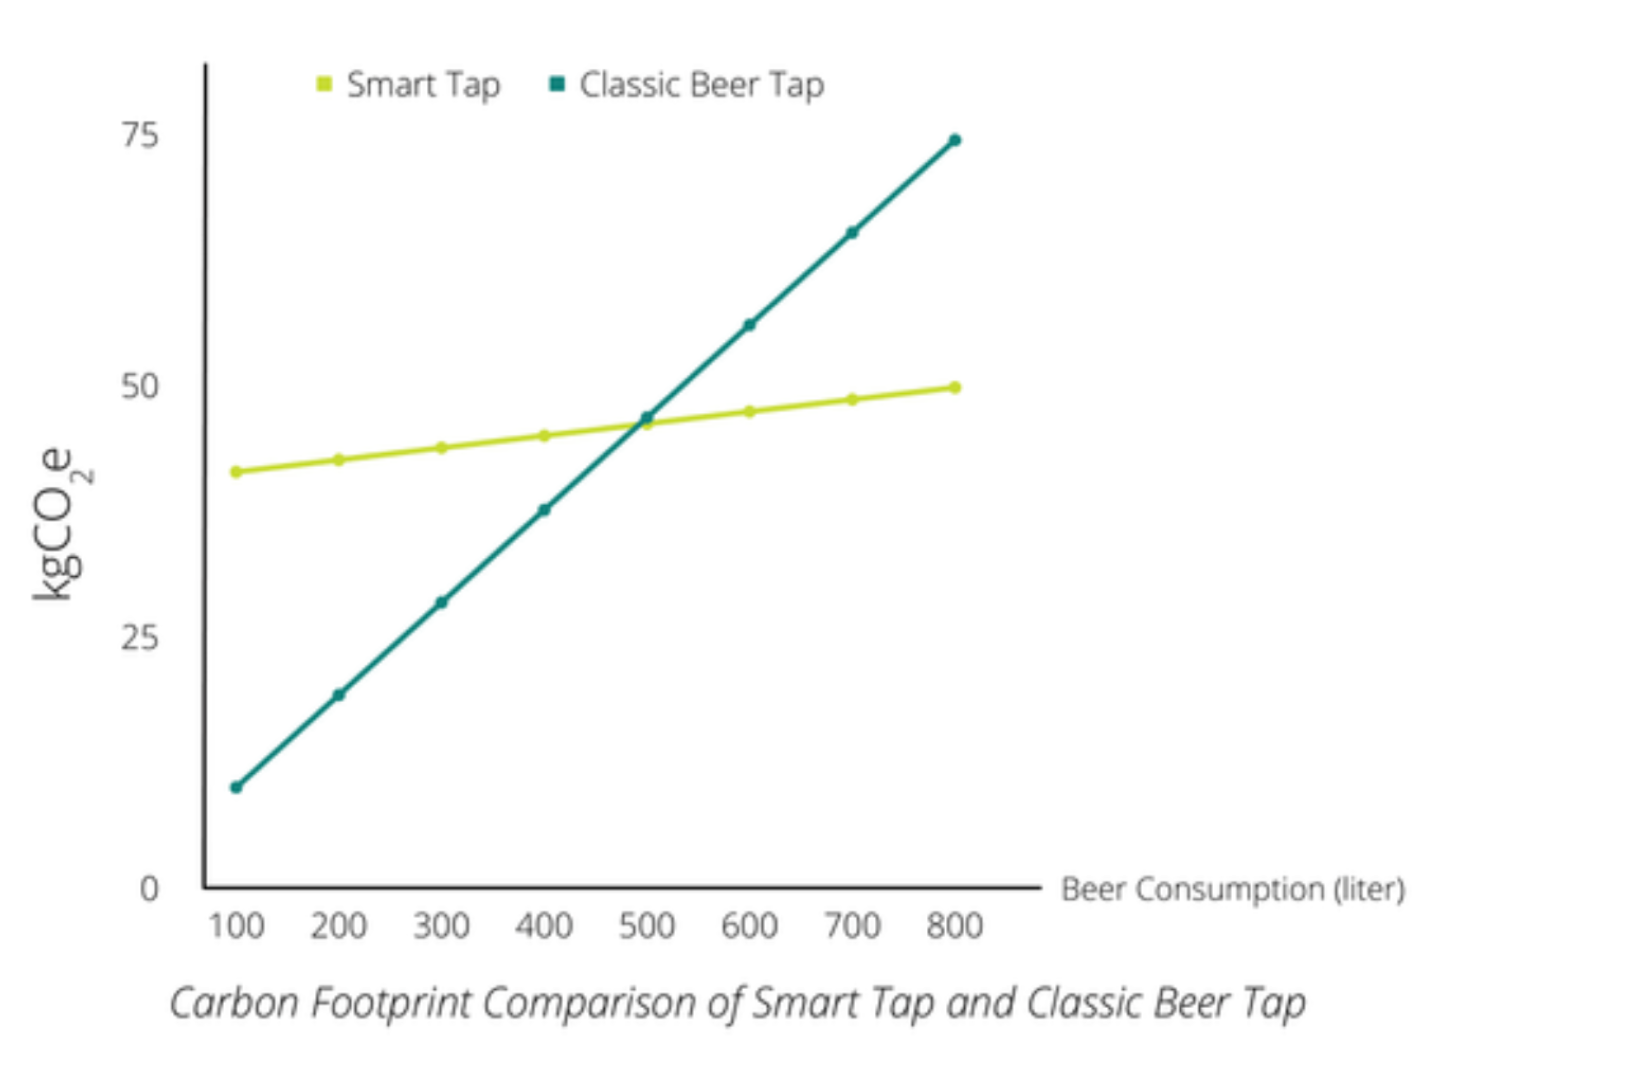
It can be inferred that the Smart Tap will start to produce less carbon emissions than the traditional tap after dispensing a total of 493 liters of beer.
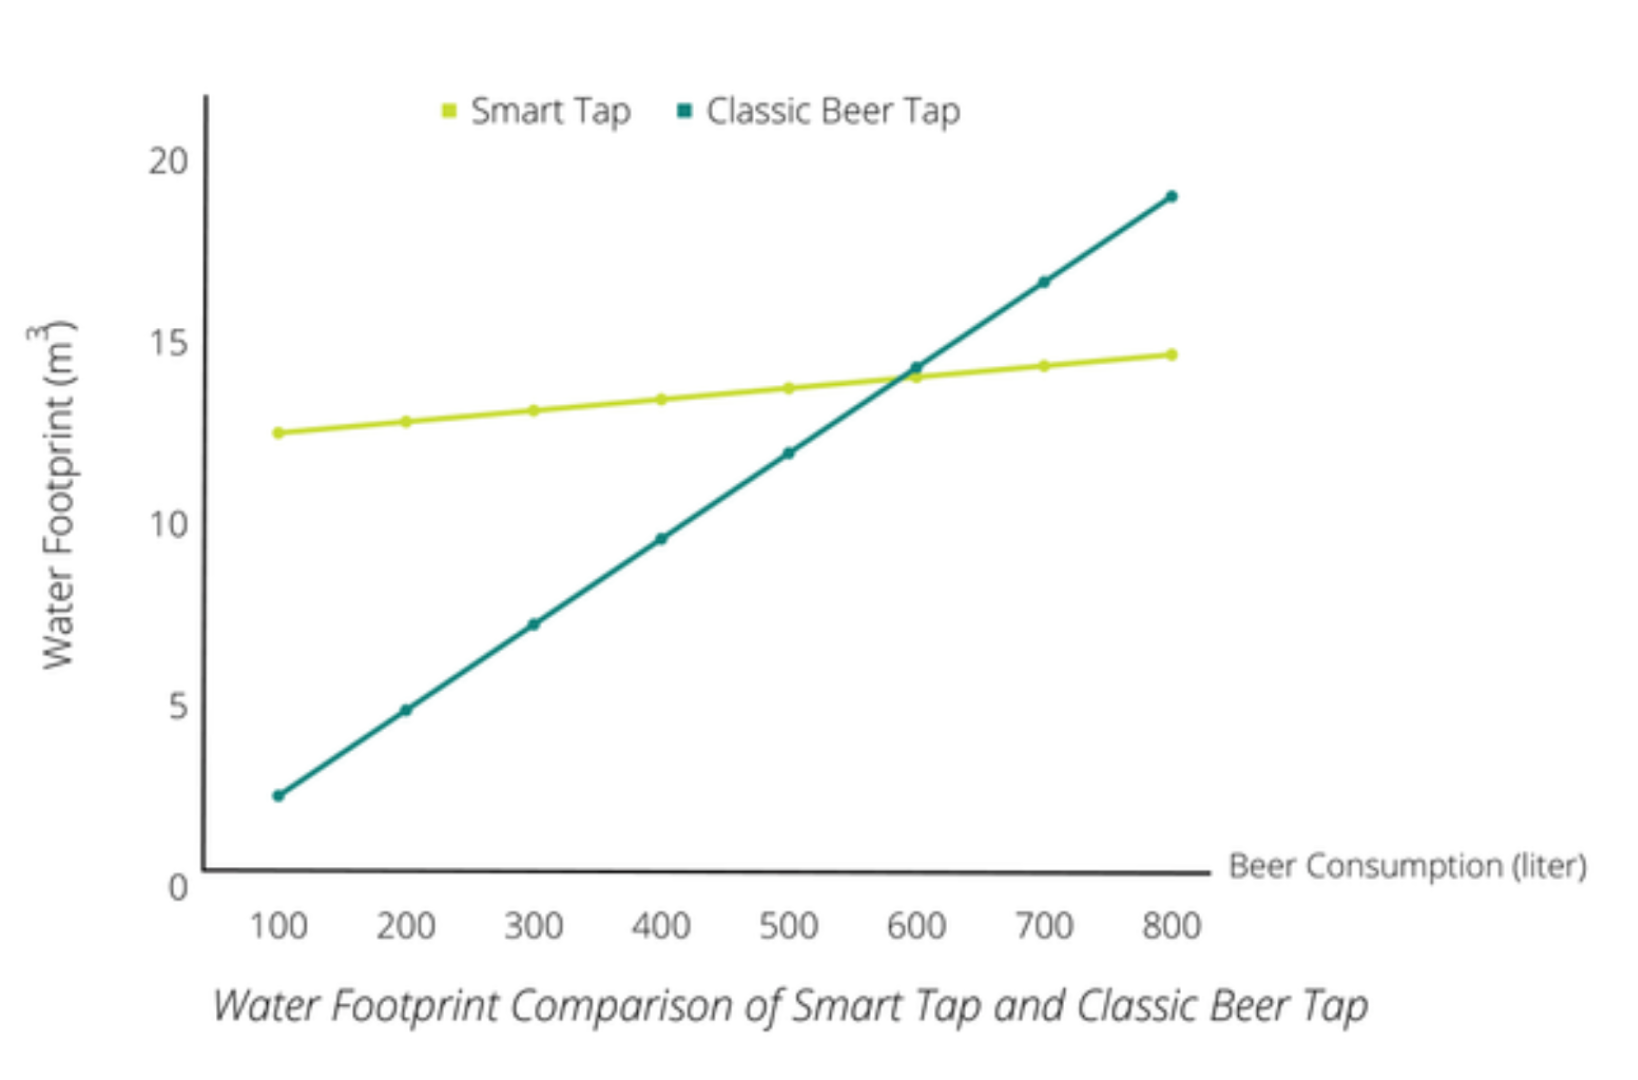
The Smart Tap device will start to use less water than traditional taps after dispensing a total of 588 liters of beer.